
Established in 2003, the Governor’s Award of Excellence (GAE) recognizes healthcare providers that demonstrate outstanding commitment to addressing some of Michigan’s most pressing health challenges. iMPROve Health partners closely with the Michigan Health & Hospital Association (MHA) Keystone Center and the Governor of Michigan to administer this prestigious award program. The most recent GAE cycle concluded in September 2024.
Data was collected over a 5-year performance period, including collection of baseline data with national benchmarking.
Who and why the award? Who qualifies.
The GAE program brings together hundreds of organizations across the care continuum, large systems, small rural providers, community coalitions, physician offices, nursing homes, and emergency departments, all working toward the same goal: delivering safer, more reliable, and more equitable care. What makes the program meaningful is not just the recognition itself, but the way it creates a shared framework for improvement and a moment for teams to see the impact of their work reflected back to them.
Methodological Note:
Relative Improvement Rate (RIR): The proportional change relative to the baseline rate, calculated as the change divided by the baseline rate and expressed as a percentage. Absolute Improvement Rate (AIR): The direct change in a measure, calculated as the difference between the follow-up rate and the baseline rate, expressed in percentage points.
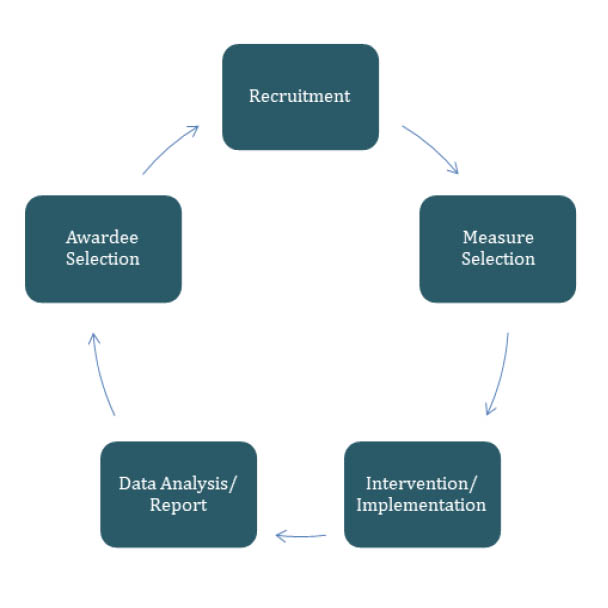
At a glance — Key Numbers
Across all settings, teams shared how the GAE process helped them sharpen their focus, strengthen internal alignment, and communicate the value of their work to leadership and community partners. Many described the recognition as a morale boost; others said the process itself clarified their next steps, even if they did not receive an award this cycle. These reflections underscore the true purpose of the GAE program: to build improvement capacity everywhere, not just to celebrate the highest performers.
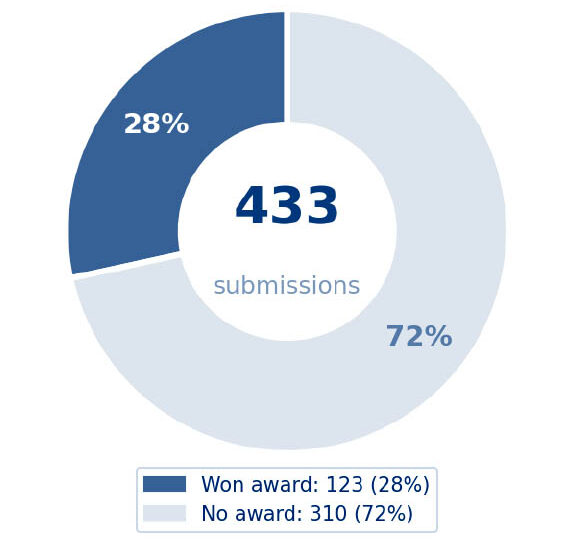
433
Total Submissions
From 9 care settings
123
Awards Won
28% of all nominations
310
Did Not Win
Room to improve
71%
Best Win Rate
EDTC — 10 of 14 won
433
Total Submissions
123
Awards Won
310
Did Not Win
EDTC 71%
Highest Rate
TO1 13%
Lowest Rate
28.4%
Overall Avg Rate
Summary of who is winning awards, why it matters, and what to do next.
During the performance period, 433 organizations participated, and 28.4% reached award-level performance. That percentage is more than a measure of achievement, it reflects the diversity of the program and the realities of improvement work across settings. Some categories, like EDTCs and self-reporting physician offices, saw award rates above 65–70%, showing what’s possible when strong processes and engaged teams align. Others, such as community coalitions and hospitals/CAHs, faced more complex barriers, from staffing constraints to competing priorities. Their lower award rates are not signs of failure, they are signals of where deeper support, coaching, and resource alignment can accelerate progress.
Who is Winning?
Each bar = % of that setting’s submissions that won an award.
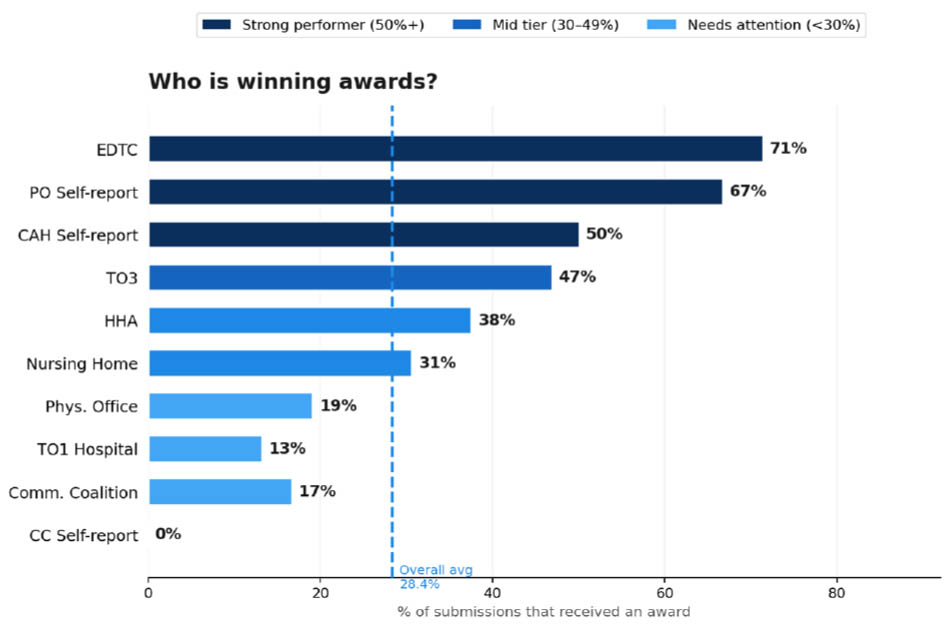
Strong performer (50%+)
- EDTC 71%
- PO Self-report 67%
- CAH Self-report 50%
Mid tier (30–49%)
- TO3 47%
- HHA 38%
- Nursing Home 31%
Needs attention (<30%)
- Phys. Office 19%
- TO1 Hospital 13%
- Comm. Coalition 17%
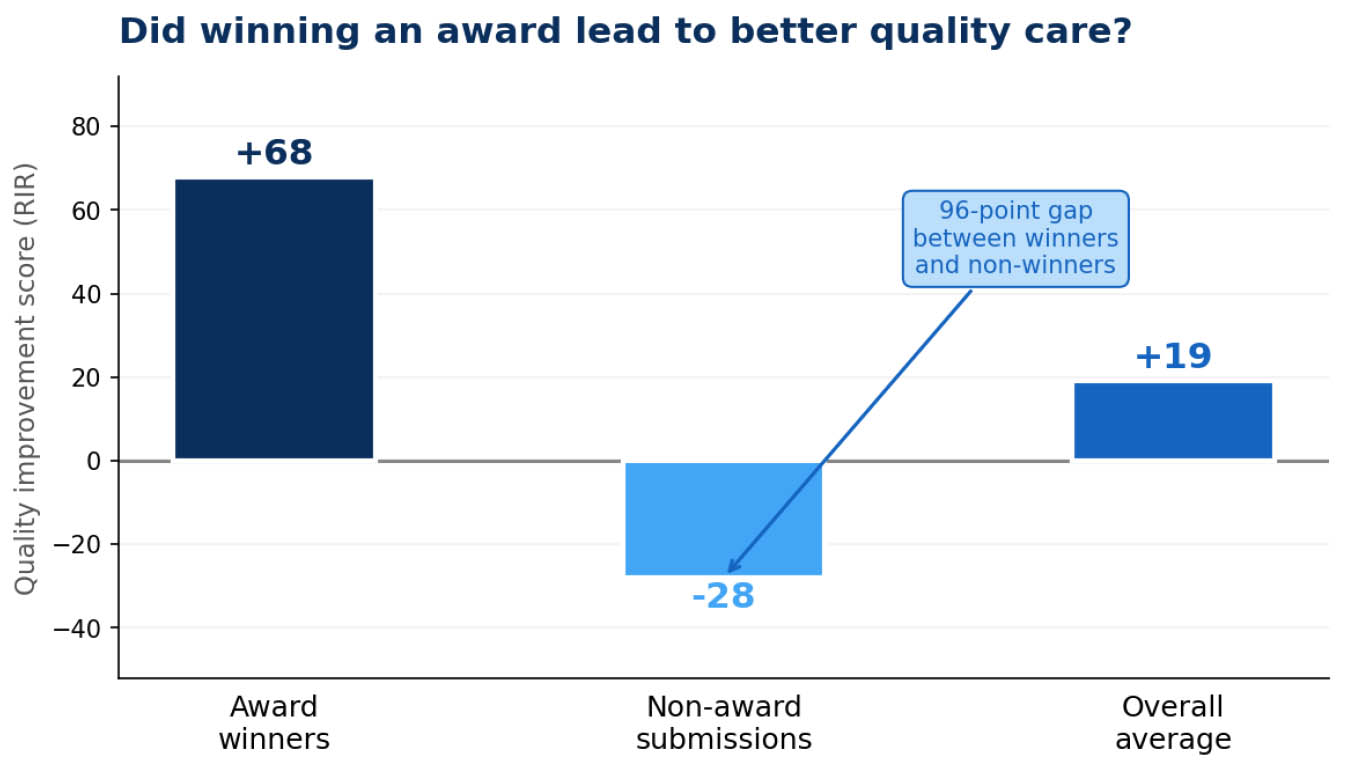
Does winning an award lead to better quality care?
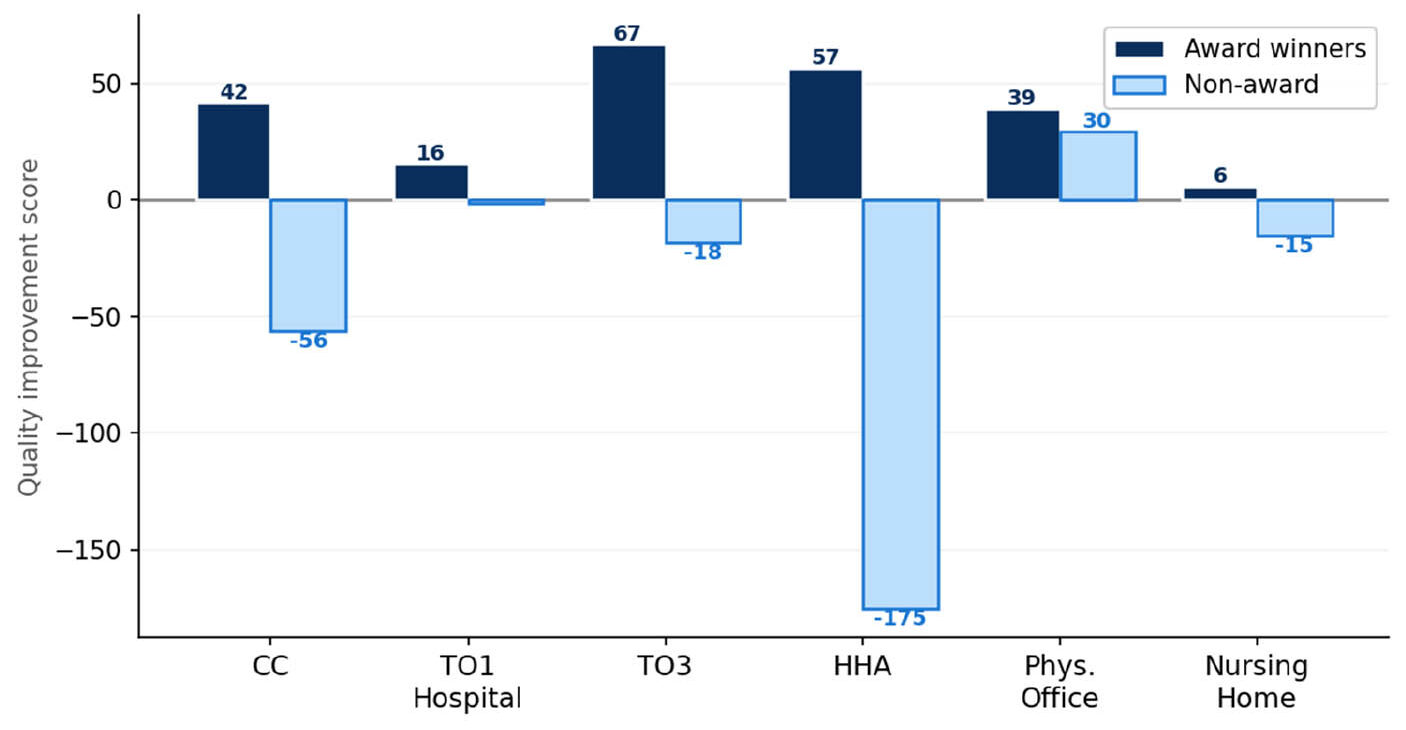
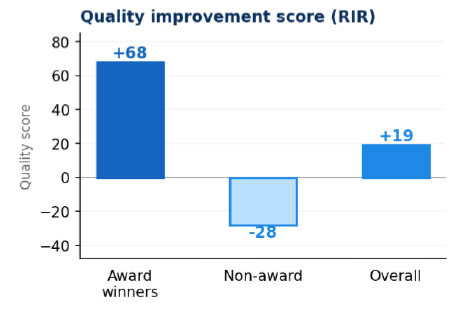
Relative Improvement Rate (RIR) reflects the degree of quality improvement achieved over time—higher values indicate stronger performance gains. Award winners improved by an average of +68 points, while nonword submissions declined by –28 points, creating a 96 point performance gap. This difference demonstrates that organizations pursuing and achieving award level performance consistently deliver stronger, more meaningful improvements in care quality. Absolute Improvement Rate (AIR) measures how much a rate has increased or decreased in absolute terms (percentage points).
Interpretation:
Award recognition is strongly associated with meaningful and consistent performance improvement, while non-awareness show limited or declining improvement trends.
Quality improvement by care setting; Award winners vs others
Awardees demonstrated the strongest improvement across settings. TO3 achieved the highest Relative Improvement Rate (RIR) among “lower‑is‑better” measures at 67%, while Physician Offices led all “higher‑is‑better” measures with a 136% RIR.
In contrast, non‑awardees showed predominantly negative RIRs, with only a few isolated areas of improvement, underscoring the consistency and depth of progress among award‑winning submissions.
Where is the biggest opportunity?
Award recognition is strongly associated with meaningful and consistent performance improvement, while non-awardees show limited or declining improvement trends.
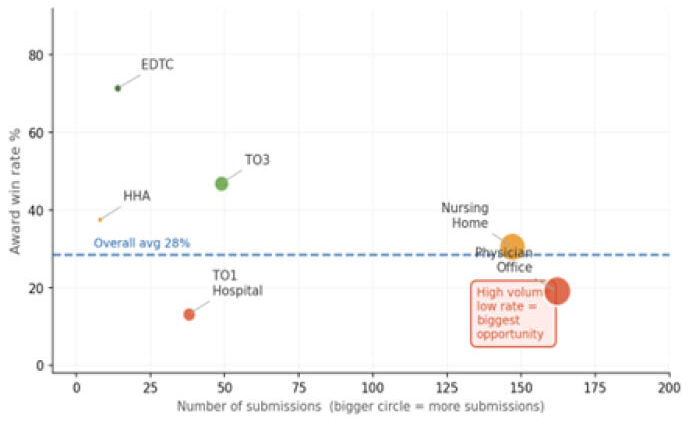
Bigger circles = more submissions. Higher = better win rate.
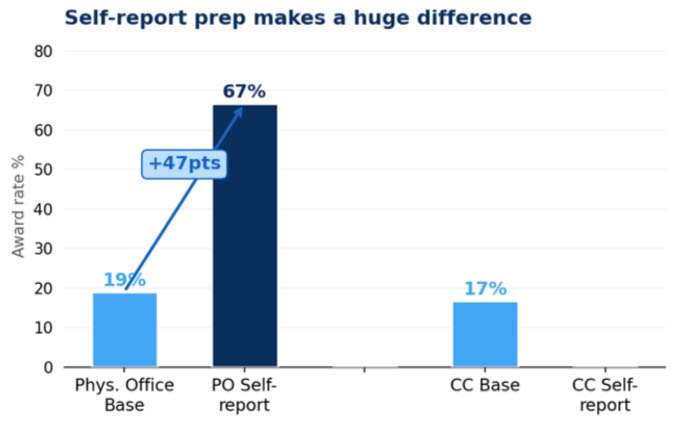
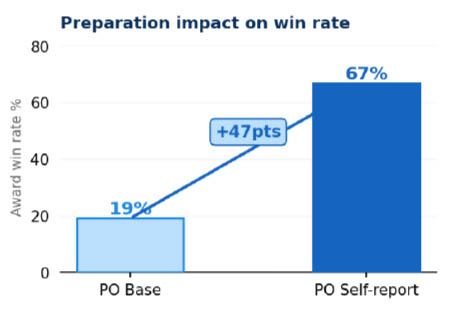
Does preparation make a difference?
Compare the same setting with vs without structured self-report prep.
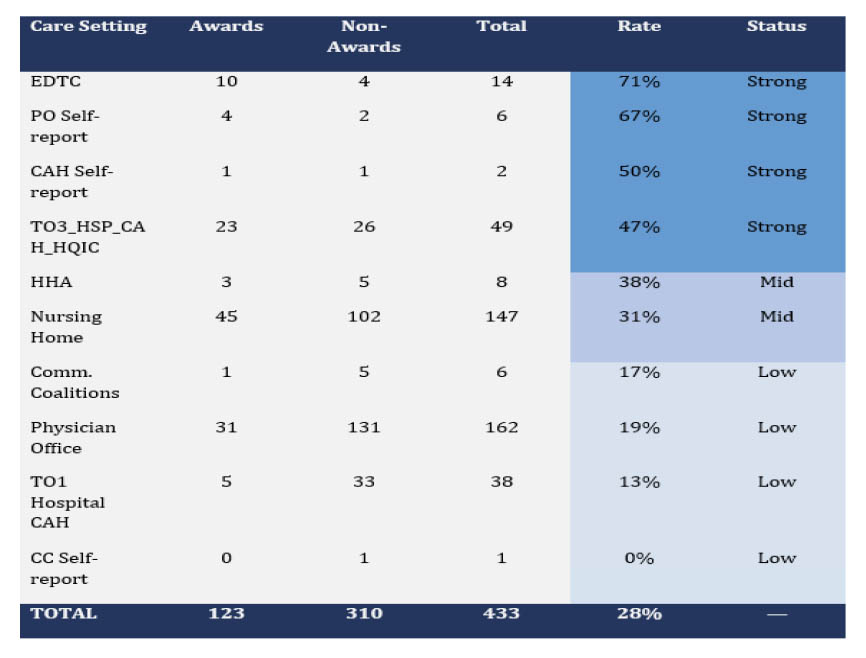
EDTC = Emergency Department Transfer Communication; HQIC = Hospital Quality Improvement Contractor; CAH = Critical Access Hospital
HHA = Home Health Agency; PO = Physician Office.
Summary Result by Care settings
The story emerging from the performance period data is one of commitment and resilience. It shows a network of organizations navigating real-world challenges while continuing to push toward better outcomes. It highlights where improvement is thriving, where momentum is building, and where targeted support can help more organizations reach award-level performance in the next cycle. Most importantly, it reinforces that progress is collective, and that every organization, regardless of size or setting, has a place in this shared journey toward excellence.
3 Key Take Aways and 4 Recommended Steps
+96 points
Winning = improving quality
Award winners improved by +68 pts. Non-winners dropped -28 pts. This 96-point gap proves award pursuit drives better care.
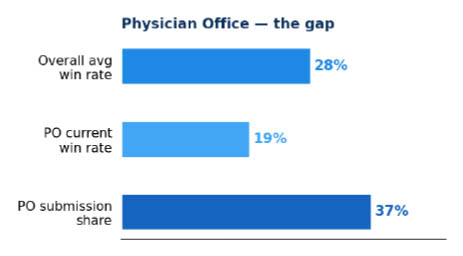
162 submissions
Physician Office is the biggest unlock
162 submissions, only 19% win rate. This single setting is 37% of all submissions. Small gains here move the overall numbers most.
+47 point gap
Preparation dramatically improves results
PO Self-report wins 67% vs 19% for regular PO — a 47-point gap. Being prepared before submitting is the biggest lever.
4 Recommended Next Steps
Help Physician Office and TO1 Hospital
Coaching and pre-submission review for these high-volume, low-rate settings could unlock the most new awards.
| 162 subs | 19% rate | Highest opportunity |
Copy what EDTC and TO3 are doing
At 71% and 47% win rates, these settings are succeeding. Document and share their process across all settings.
| EDTC 71% | TO3 47% | Best practices |
Make self-report preparation standard
Self-report categories outperform base by 40–50 points. Build structured prep into the standard workflow for all.
| +47pt gain | Scalable |
Share the quality data with frontline teams
The 96-point RIR gap motivates teams. When they see award pursuit leads to better patient care, engagement grows.
| 96pt gap | Engagement driver |
433
Total Submissions28.4%
Overall award rate+96pt
RIR gap (award vs no award)EDTC 71%
Highest performing settingThe GAE program continues to demonstrate the power of a unified improvement community. This year’s results reflect meaningful achievements across the region and provide a clear roadmap for where additional support can drive even greater impact. The variation in award rates is not a gap, it is guidance. It shows us where improvement is taking hold, where successful models can be scaled, and where deeper coaching or resources can help organizations move from progress to excellence.
What stands out most is the dedication behind the data. Teams showed up despite staffing shortages, competing demands, and the daily pressures of delivering care. Their participation, and their willingness to measure, reflect, and improve, embodies the spirit of the GAE program. Recognition is one outcome, but the real success lies in the collective movement toward safer, more reliable, and more equitable care.
As we look ahead, we will continue to listen to the experiences behind the numbers and align our support with what organizations say they need most. The GAE program remains a catalyst for growth, helping teams see what’s possible, celebrate what’s working, and stay focused on the shared goal of improving care for every community we serve.